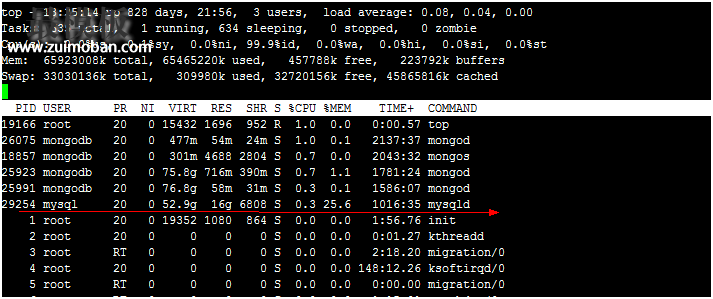
nagios报警,线上一台从库检测不到slave状态,于是远程上去查看问题:1,show slave status\G卡住:Type 'help;' or '\h' for help. Type '\c' to clear the current input statement. mysql> show slave status\G show slave status卡住了,动弹不了,这种情况还是第一次遇到。 2,看w负载无压力:[root@tmp3_72 ~]# w 13:23:31 up 828 days, 21:54, 3 users, load average: 0.08, 0.05, 0.00 USER TTY FROM LOGIN@ IDLE JCPU PCPU WHAT root tty1 - 29Sep13 827days 0.15s 0.15s -bash root pts/0 192.168.120.28 13:19 3:49 0.18s 0.14s mysql root pts/1 192.168.120.28 13:23 0.00s 0.08s 0.02s w [root@tmp3_72 ~]# [root@tmp3_72 ~]# [root@tmp3_72 ~]# 3,Top看mysqld进程占据cpu才0.3%
4,查看error日志,没有发现异常记录:[root@tmp3_72 mysql]# tail -f /usr/local/mysql/mysqld.log 2015-12-29 20:35:31 29254 [Note] - '::' resolves to '::'; 2015-12-29 20:35:31 29254 [Note] Server socket created on IP: '::'. 2015-12-29 20:35:31 29254 [Note] Event Scheduler: Loaded 0 events 2015-12-29 20:35:31 29254 [Note] /usr/local/mysql/bin/mysqld: ready for connections. Version: '5.6.12-log' socket: '/usr/local/mysql/mysql.sock' port: 3306 Source distribution 2015-12-29 20:35:40 29254 [Note] 'CHANGE MASTER TO executed'. Previous state master_host='', master_port= 3306, master_log_file='', master_log_pos= 4, master_bind=''. New state master_host='', master_port= 3306, master_log_file='mysql-bin.036282', master_log_pos= 120, master_bind=''. 2015-12-30 10:00:04 29254 [Note] 'CHANGE MASTER TO executed'. Previous state master_host='', master_port= 3306, master_log_file='', master_log_pos= 4, master_bind=''. New state master_host='192.168.12.71', master_port= 3306, master_log_file='mysql-bin.036282', master_log_pos= 120, master_bind=''. 2015-12-30 10:00:04 29254 [Note] Slave SQL thread initialized, starting replication in log 'mysql-bin.036282' at position 120, relay log './mysql-relay-bin.000001' position: 4 2015-12-30 10:00:04 29254 [Warning] Storing MySQL user name or password information in the master.info repository is not secure and is therefore not recommended. Please see the MySQL Manual for more about this issue and possible alternatives. 2015-12-30 10:00:04 29254 [Note] Slave I/O thread: connected to master 'repl@192.168.12.71:3306',replication started in log 'mysql-bin.036282' at position 120 5,查看到后台的mysql进程,有一个mysqldump备份进程,执行了很久,我kill掉试试看[root@tmp3_72 mysql]# ps -eaf|grep mysql root 16100 16094 0 12:00 ? 00:00:00 /bin/sh -c /home/data/mysql/backup/scripts/backup_full.sh root 16104 16100 0 12:00 ? 00:00:00 /usr/local/mysql/bin/mysqldump -uroot --password= -R -E -h localhost --skip-opt --single-transaction --flush-logs --master-data=2 --add-drop-table --create-option --quick --extended-insert --set-charset --disable-keys --databases user_db plocc_system parking_db root 18986 18967 0 13:19 pts/0 00:00:00 mysql nagios 19486 19485 0 13:33 ? 00:00:00 /usr/local/nagios/libexec/check_mysql -unagios -P3306 -S -s /usr/local/mysql/mysql.sock -Hlocalhost --password=XXXXXXXXXXXX -d test -w 60 -c 100 root 19511 19121 0 13:34 pts/1 00:00:00 grep mysql root 28242 1 0 2015 ? 00:00:00 /bin/sh /usr/local/mysql/bin/mysqld_safe --datadir=/home/data/mysql/data --pid-file=/usr/local/mysql/mysqld.pid mysql 29254 28242 9 2015 ? 16:56:36 /usr/local/mysql/bin/mysqld --basedir=/usr/local/mysql --datadir=/home/data/mysql/data --plugin-dir=/usr/local/mysql/lib/plugin --user=mysql --log-error=/usr/local/mysql/mysqld.log --open-files-limit=8192 --pid-file=/usr/local/mysql/mysqld.pid --socket=/usr/local/mysql/mysql.sock --port=3306 [root@tmp3_72 mysql]# kill -9 16104 [root@tmp3_72 mysql]# [root@tmp3_72 mysql]# [root@tmp3_72 mysql]# ps -eaf|grep mysql root 18986 18967 0 13:19 pts/0 00:00:00 mysql root 19555 19121 0 13:34 pts/1 00:00:00 grep mysql root 28242 1 0 2015 ? 00:00:00 /bin/sh /usr/local/mysql/bin/mysqld_safe --datadir=/home/data/mysql/data --pid-file=/usr/local/mysql/mysqld.pid mysql 29254 28242 9 2015 ? 16:56:36 /usr/local/mysql/bin/mysqld --basedir=/usr/local/mysql --datadir=/home/data/mysql/data --plugin-dir=/usr/local/mysql/lib/plugin --user=mysql --log-error=/usr/local/mysql/mysqld.log --open-files-limit=8192 --pid-file=/usr/local/mysql/mysqld.pid --socket=/usr/local/mysql/mysql.sock --port=3306 [root@tmp3_72 mysql]# 6,kill掉备份进程后,执行一条简单的delete语句,会卡住,看来kill解决不了问题mysql> select * from test; +------+------+ | id | name | +------+------+ | 0 | NULL | | 1 | NULL | | 2 | NULL | | 3 | NULL | +------+------+ 4 rows in set (0.02 sec) mysql> mysql> mysql> delete from test where id=0; 去查询当前进程:mysql> select User,State,count(1) from information_schema.processlist group by User,State; +--------------+----------------------------------------+----------+ | User | State | count(1) | +--------------+----------------------------------------+----------+ | cacti_user | | 17 | | cacti_user | executing | 657 | | nagios | executing | 38 | | ploccsys_web | | 10 | | root | executing | 1 | | root | init | 2 | | system user | Queueing master event to the relay log | 1 | | system user | Waiting for commit lock | 1 | +--------------+----------------------------------------+----------+ 8 rows in set (0.01 sec) mysql> 有许多类似下面的线程:| 516544 | cacti_user | 192.168.11.12:42082 | NULL | Query | 375 | executing | SHOW /*!50002 GLOBAL */ STATUS | | 516564 | cacti_user | 192.168.11.12:42208 | NULL | Query | 350 | executing | SHOW /*!50002 GLOBAL */ STATUS | | 516571 | cacti_user | 192.168.11.12:42215 | NULL | Query | 330 | executing | SHOW /*!50002 GLOBAL */ STATUS | | 516575 | cacti_user | 192.168.11.12:42218 | NULL | Query | 320 | executing | SHOW /*!50002 GLOBAL */ STATUS | | 516592 | cacti_user | 192.168.11.12:42230 | NULL | Query | 315 | executing | SHOW /*!50002 GLOBAL */ STATUS | | 516598 | cacti_user | 192.168.11.12:42359 | NULL | Query | 300 | executing | SHOW /*!50002 GLOBAL */ STATUS | 要不要重启mysql db或者是重启cacti服务器?想来还是继续再看看,万不得已不能用绝招。^_^ 7,写了个脚本来kill这些来自cacti的show status的线程
[root@tmp3_72 scripts]# vim killsleep_cacti.sh

#It is used to kill processlist of mysql sleep
#!/bin/sh
while :

do
  n=`mysqladmin processlist -uroot --password=""|grep -i sleep |wc -l`
  date=`date +%Y%m%d\[%H:%M:%S]`
  echo $n

  if [ "$n" -gt 10 ]
  then
  echo "begin kill the sleep processlist ......"
  for i in `mysqladmin processlist -uroot --password=""|grep -i sleep |awk '{print $2}'`
  do
     mysqladmin -uroot --password="" kill $i
  done
  echo "begin kill the executing cacti show status processlist ......"
  for i in `mysqladmin processlist -uroot --password=""|grep -i executing |grep -i SHOW|grep -i STATUS |grep -i cacti |awk '{print $2}'`
  do
     mysqladmin -uroot --password="" kill $i
  done

  echo "sleep is too many I killed it " >> /tmp/sleep.log
  echo "$date : $n" >> /tmp/sleep.log
  fi
  sleep 1
done
执行后,通过show full processlist;这些线程仍然存在,只是状态从excuteing变成了killed而已:其它问题仍然没有改观mysql> select User,Command,count(1) from information_schema.processlist group by User,Command; +--------------+---------+----------+ | User | Command | count(1) | +--------------+---------+----------+ | cacti_user | Killed | 792 | | cacti_user | Query | 4 | | cacti_user | Sleep | 1 | | nagios | Query | 48 | | ploccsys_web | Sleep | 10 | | root | Killed | 1 | | root | Query | 2 | | root | Refresh | 1 | | system user | Connect | 2 | +--------------+---------+----------+ 9 rows in set (0.01 sec) mysql> 7,重新查看slave状态,还是无效mysql> show slave status\G ERROR 2006 (HY000): MySQL server has gone away No connection. Trying to reconnect... Connection id: 523275 Current database: test 8,去查看engine状态mysql> show engine innodb status\G *************************** 1. row *************************** Type: InnoDB Name: Status: ===================================== 2016-01-06 15:08:52 7f3ef5a19700 INNODB MONITOR OUTPUT ===================================== Per second averages calculated from the last 50 seconds ----------------- BACKGROUND THREAD ----------------- srv_master_thread loops: 475489 srv_active, 0 srv_shutdown, 195322 srv_idle srv_master_thread log flush and writes: 670800 ---------- SEMAPHORES ---------- OS WAIT ARRAY INFO: reservation count 697461 OS WAIT ARRAY INFO: signal count 710269 Mutex spin waits 2340260, rounds 18635522, OS waits 498279 RW-shared spins 132111, rounds 3631441, OS waits 119612 RW-excl spins 25200, rounds 2213112, OS waits 70336 Spin rounds per wait: 7.96 mutex, 27.49 RW-shared, 87.82 RW-excl ------------ TRANSACTIONS ------------ Trx id counter 1247855846 Purge done for trx's n:o < 1247855835 undo n:o < 0 state: running but idle History list length 2442 LIST OF TRANSACTIONS FOR EACH SESSION: ---TRANSACTION 0, not started MySQL thread id 523731, OS thread handle 0x7f3ef5a19700, query id 150089612 localhost root init show engine innodb status ---TRANSACTION 0, not started MySQL thread id 522540, OS thread handle 0x7f3ef7ea8700, query id 150086762 localhost root executing SHOW /*!50002 GLOBAL */ STATUS ---TRANSACTION 1247853306, not started MySQL thread id 35671, OS thread handle 0x7f4bf8083700, query id 0 Queueing master event to the relay log ---TRANSACTION 1247855447, ACTIVE 11330 sec mysql tables in use 1, locked 1 2 lock struct(s), heap size 376, 1 row lock(s), undo log entries 1 MySQL thread id 35672, OS thread handle 0x7f4bf8052700, query id 150059111 Waiting for commit lock -------- FILE I/O -------- I/O thread 0 state: waiting for i/o request (insert buffer thread) I/O thread 1 state: waiting for i/o request (log thread) I/O thread 2 state: waiting for i/o request (read thread) I/O thread 3 state: waiting for i/o request (read thread) I/O thread 4 state: waiting for i/o request (read thread) I/O thread 5 state: waiting for i/o request (read thread) I/O thread 6 state: waiting for i/o request (write thread) I/O thread 7 state: waiting for i/o request (write thread) I/O thread 8 state: waiting for i/o request (write thread) I/O thread 9 state: waiting for i/o request (write thread) Pending normal aio reads: 0 [0, 0, 0, 0] , aio writes: 0 [0, 0, 0, 0] , ibuf aio reads: 0, log i/o's: 0, sync i/o's: 0 Pending flushes (fsync) log: 0; buffer pool: 0 9067 OS file reads, 129305477 OS file writes, 12754944 OS fsyncs 0.00 reads/s, 0 avg bytes/read, 0.00 writes/s, 0.00 fsyncs/s ------------------------------------- INSERT BUFFER AND ADAPTIVE HASH INDEX ------------------------------------- Ibuf: size 1, free list len 11, seg size 13, 0 merges merged operations: insert 0, delete mark 0, delete 0 discarded operations: insert 0, delete mark 0, delete 0 Hash table size 75692179, node heap has 2437 buffer(s) 0.00 hash searches/s, 0.00 non-hash searches/s --- LOG --- Log sequence number 418264709881 Log flushed up to 418264709881 Pages flushed up to 418264709881 Last checkpoint at 418264709881 0 pending log writes, 0 pending chkp writes 110060310 log i/o's done, 0.00 log i/o's/second ---------------------- BUFFER POOL AND MEMORY ---------------------- Total memory allocated 35165044736; in additional pool allocated 0 Dictionary memory allocated 1420595 Buffer pool size 2097144 Free buffers 1375231 Database pages 719476 Old database pages 265424 Modified db pages 0 Pending reads 0 Pending writes: LRU 0, flush list 0, single page 0 Pages made young 1474, not young 0 0.00 youngs/s, 0.00 non-youngs/s Pages read 91286, created 628190, written 34807582 0.00 reads/s, 0.00 creates/s, 0.00 writes/s No buffer pool page gets since the last printout Pages read ahead 0.00/s, evicted without access 0.00/s, Random read ahead 0.00/s LRU len: 719476, unzip_LRU len: 0 I/O sum[0]:cur[0], unzip sum[0]:cur[0] ---------------------- INDIVIDUAL BUFFER POOL INFO ---------------------- ---BUFFER POOL 0 Buffer pool size 262143 Free buffers 172002 Database pages 89836 Old database pages 33142 Modified db pages 0 Pending reads 0 Pending writes: LRU 0, flush list 0, single page 0 Pages made young 97, not young 0 0.00 youngs/s, 0.00 non-youngs/s Pages read 11534, created 78302, written 5644943 0.00 reads/s, 0.00 creates/s, 0.00 writes/s No buffer pool page gets since the last printout Pages read ahead 0.00/s, evicted without access 0.00/s, Random read ahead 0.00/s LRU len: 89836, unzip_LRU len: 0 I/O sum[0]:cur[0], unzip sum[0]:cur[0] ---BUFFER POOL 1 Buffer pool size 262143 Free buffers 171914 Database pages 89924 Old database pages 33174 Modified db pages 0 Pending reads 0 Pending writes: LRU 0, flush list 0, single page 0 Pages made young 259, not young 0 0.00 youngs/s, 0.00 non-youngs/s Pages read 11425, created 78499, written 3352647 0.00 reads/s, 0.00 creates/s, 0.00 writes/s No buffer pool page gets since the last printout Pages read ahead 0.00/s, evicted without access 0.00/s, Random read ahead 0.00/s LRU len: 89924, unzip_LRU len: 0 I/O sum[0]:cur[0], unzip sum[0]:cur[0] ---BUFFER POOL 2 Buffer pool size 262143 Free buffers 171570 Database pages 90267 Old database pages 33301 Modified db pages 0 Pending reads 0 Pending writes: LRU 0, flush list 0, single page 0 Pages made young 158, not young 0 0.00 youngs/s, 0.00 non-youngs/s Pages read 11720, created 78547, written 2182721 0.00 reads/s, 0.00 creates/s, 0.00 writes/s No buffer pool page gets since the last printout Pages read ahead 0.00/s, evicted without access 0.00/s, Random read ahead 0.00/s LRU len: 90267, unzip_LRU len: 0 I/O sum[0]:cur[0], unzip sum[0]:cur[0] ---BUFFER POOL 3 Buffer pool size 262143 Free buffers 172120 Database pages 89724 Old database pages 33100 Modified db pages 0 Pending reads 0 Pending writes: LRU 0, flush list 0, single page 0 Pages made young 141, not young 0 0.00 youngs/s, 0.00 non-youngs/s Pages read 11117, created 78607, written 8155448 0.00 reads/s, 0.00 creates/s, 0.00 writes/s No buffer pool page gets since the last printout Pages read ahead 0.00/s, evicted without access 0.00/s, Random read ahead 0.00/s LRU len: 89724, unzip_LRU len: 0 I/O sum[0]:cur[0], unzip sum[0]:cur[0] ---BUFFER POOL 4 Buffer pool size 262143 Free buffers 171665 Database pages 90167 Old database pages 33264 Modified db pages 0 Pending reads 0 Pending writes: LRU 0, flush list 0, single page 0 Pages made young 142, not young 0 0.00 youngs/s, 0.00 non-youngs/s Pages read 11675, created 78492, written 7450709 0.00 reads/s, 0.00 creates/s, 0.00 writes/s No buffer pool page gets since the last printout Pages read ahead 0.00/s, evicted without access 0.00/s, Random read ahead 0.00/s LRU len: 90167, unzip_LRU len: 0 I/O sum[0]:cur[0], unzip sum[0]:cur[0] ---BUFFER POOL 5 Buffer pool size 262143 Free buffers 172081 Database pages 89746 Old database pages 33108 Modified db pages 0 Pending reads 0 Pending writes: LRU 0, flush list 0, single page 0 Pages made young 185, not young 0 0.00 youngs/s, 0.00 non-youngs/s Pages read 11258, created 78488, written 3505157 0.00 reads/s, 0.00 creates/s, 0.00 writes/s No buffer pool page gets since the last printout Pages read ahead 0.00/s, evicted without access 0.00/s, Random read ahead 0.00/s LRU len: 89746, unzip_LRU len: 0 I/O sum[0]:cur[0], unzip sum[0]:cur[0] ---BUFFER POOL 6 Buffer pool size 262143 Free buffers 173275 Database pages 88569 Old database pages 32674 Modified db pages 0 Pending reads 0 Pending writes: LRU 0, flush list 0, single page 0 Pages made young 336, not young 0 0.00 youngs/s, 0.00 non-youngs/s Pages read 10622, created 77947, written 2488265 0.00 reads/s, 0.00 creates/s, 0.00 writes/s No buffer pool page gets since the last printout Pages read ahead 0.00/s, evicted without access 0.00/s, Random read ahead 0.00/s LRU len: 88569, unzip_LRU len: 0 I/O sum[0]:cur[0], unzip sum[0]:cur[0] ---BUFFER POOL 7 Buffer pool size 262143 Free buffers 170604 Database pages 91243 Old database pages 33661 Modified db pages 0 Pending reads 0 Pending writes: LRU 0, flush list 0, single page 0 Pages made young 156, not young 0 0.00 youngs/s, 0.00 non-youngs/s Pages read 11935, created 79308, written 2027692 0.00 reads/s, 0.00 creates/s, 0.00 writes/s No buffer pool page gets since the last printout Pages read ahead 0.00/s, evicted without access 0.00/s, Random read ahead 0.00/s LRU len: 91243, unzip_LRU len: 0 I/O sum[0]:cur[0], unzip sum[0]:cur[0] -------------- ROW OPERATIONS -------------- 0 queries inside InnoDB, 0 queries in queue 0 read views open inside InnoDB Main thread process no. 29254, id 139925894604544, state: sleeping Number of rows inserted 71967166, updated 94419979, deleted 45975, read 7366029184 0.00 inserts/s, 0.00 updates/s, 0.00 deletes/s, 0.00 reads/s ---------------------------- END OF INNODB MONITOR OUTPUT ============================ 1 row in set (0.02 sec) mysql> 9,去查看是否有locks信息
mysql> select * from information_schema.INNODB_TRX\G;
*************************** 1. row ***************************
                    trx_id: 1247855447
                 trx_state: RUNNING
               trx_started: 2016-01-06 12:00:02
     trx_requested_lock_id: NULL
          trx_wait_started: NULL
                trx_weight: 3
       trx_mysql_thread_id: 35672
                 trx_query: NULL
       trx_operation_state: NULL
         trx_tables_in_use: 1
         trx_tables_locked: 1
          trx_lock_structs: 2
     trx_lock_memory_bytes: 376
           trx_rows_locked: 1
         trx_rows_modified: 1
   trx_concurrency_tickets: 0
       trx_isolation_level: READ COMMITTED
         trx_unique_checks: 1
    trx_foreign_key_checks: 1
trx_last_foreign_key_error: NULL
 trx_adaptive_hash_latched: 0
 trx_adaptive_hash_timeout: 10000
          trx_is_read_only: 0
trx_autocommit_non_locking: 0
1 row in set (0.00 sec)

ERROR:
No query specified

mysql>

mysql> select * from INNODB_LOCKS;
Empty set (0.00 sec)

mysql>
mysql>
mysql>
mysql> select * from INNODB_LOCK_WAITS;
Empty set (0.00 sec)

mysql>
有一个事务是running状态,根据trx_mysql_thread_id: 35672查询processlist表:mysql> select * from processlist where id=35672; +-------+-------------+------+------+---------+-------+-------------------------+------+ | ID | USER | HOST | DB | COMMAND | TIME | STATE | INFO | +-------+-------------+------+------+---------+-------+-------------------------+------+ | 35672 | system user | | NULL | Connect | 11948 | Waiting for commit lock | NULL | +-------+-------------+------+------+---------+-------+-------------------------+------+ 1 row in set (0.01 sec) mysql> 正常的从服务器是:mysql> select * from processlist order by id limit 2; +----------+-------------+------+------+---------+--------+------------------------------------------------------------------+------+ | ID | USER | HOST | DB | COMMAND | TIME | STATE | INFO | +----------+-------------+------+------+---------+--------+------------------------------------------------------------------+------+ | 29903251 | system user | | NULL | Connect | 624229 | Waiting for master to send event | NULL | | 29903252 | system user | | NULL | Connect | 5 | Slave has read all relay log; waiting for the slave I/O thread t | NULL | +----------+-------------+------+------+---------+--------+------------------------------------------------------------------+------+ 2 rows in set (0.00 sec) mysql> 而我的这台出故障的从服务器是:mysql> select * from processlist order by id limit 2; +-------+-------------+------+------+---------+--------+----------------------------------------+------+ | ID | USER | HOST | DB | COMMAND | TIME | STATE | INFO | +-------+-------------+------+------+---------+--------+----------------------------------------+------+ | 35671 | system user | | NULL | Connect | 624374 | Queueing master event to the relay log | NULL | | 35672 | system user | | NULL | Connect | 12379 | Waiting for commit lock | NULL | +-------+-------------+------+------+---------+--------+----------------------------------------+------+ 2 rows in set (0.01 sec) mysql> 再次查看统计,确定问题所在为system user | Connect | Waiting for commit lock 线程导致:mysql> select User,Command,State,count(1) from information_schema.processlist group by User,Command,State; +--------------+---------+----------------------------------------+----------+ | User | Command | State | count(1) | +--------------+---------+----------------------------------------+----------+ | cacti_user | Killed | executing | 792 | | cacti_user | Query | executing | 344 | | nagios | Query | executing | 72 | | ploccsys_web | Sleep | | 10 | | root | Killed | executing | 1 | | root | Killed | init | 5 | | root | Query | executing | 1 | | root | Query | Waiting for table flush | 1 | | root | Refresh | init | 1 | | system user | Connect | Queueing master event to the relay log | 1 | | system user | Connect | Waiting for commit lock | 1 | +--------------+---------+----------------------------------------+----------+ 11 rows in set (0.02 sec) mysql> 10,问题解决事情到此地步,已经很明确了就是Waiting for commit lock 这个导致的全局锁,所以kill掉innodb_trx中的running事务的mysql线程:
mysql> kill 35672
    -> ;
Query OK, 0 rows affected (0.00 sec)

mysql>
然后再去check processlist;已经正常了,如下所示:mysql> show full processlist; +--------+--------------+-------------------+--------------------+---------+-------+----------------------------------+-----------------------+ | Id | User | Host | db | Command | Time | State | Info | +--------+--------------+-------------------+--------------------+---------+-------+----------------------------------+-----------------------+ | 527023 | root | localhost | information_schema | Query | 0 | init | show full processlist | | 527165 | system user | | NULL | Connect | 54 | Waiting for master to send event | NULL | | 527166 | system user | | NULL | Connect | 12548 | System lock | NULL | | 527167 | ploccsys_web | 192.168.12.28:33006 | plocc_system | Sleep | 28 | | NULL | | 527168 | ploccsys_web | 192.168.12.28:33007 | plocc_system | Sleep | 28 | | NULL | | 527169 | ploccsys_web | 192.168.12.28:33008 | plocc_system | Sleep | 28 | | NULL | | 527170 | ploccsys_web | 192.168.12.28:33009 | plocc_system | Sleep | 28 | | NULL | | 527171 | ploccsys_web | 192.168.12.28:33010 | plocc_system | Sleep | 28 | | NULL | | 527172 | ploccsys_web | 192.168.12.29:43473 | plocc_system | Sleep | 16 | | NULL | | 527173 | ploccsys_web | 192.168.12.29:43474 | plocc_system | Sleep | 16 | | NULL | | 527174 | ploccsys_web | 192.168.12.29:43476 | plocc_system | Sleep | 16 | | NULL | | 527175 | ploccsys_web | 192.168.12.29:43477 | plocc_system | Sleep | 16 | | NULL | | 527176 | ploccsys_web | 192.168.12.29:43478 | plocc_system | Sleep | 16 | | NULL | +--------+--------------+-------------------+--------------------+---------+-------+----------------------------------+-----------------------+ 13 rows in set (0.00 sec) mysql> 在查看slave状态,是No状态,如下所示:
mysql> show slave status\G
*************************** 1. row ***************************
               Slave_IO_State:
                  Master_Host: 192.168.12.71
                  Master_User: repl
                  Master_Port: 3306
                Connect_Retry: 60
              Master_Log_File: mysql-bin.037579
          Read_Master_Log_Pos: 2172311
               Relay_Log_File: mysql-relay-bin.002685
                Relay_Log_Pos: 13453336
        Relay_Master_Log_File: mysql-bin.037578
             Slave_IO_Running: No
            Slave_SQL_Running: No
              Replicate_Do_DB:
          Replicate_Ignore_DB:
           Replicate_Do_Table:
       Replicate_Ignore_Table:
      Replicate_Wild_Do_Table:
  Replicate_Wild_Ignore_Table:
                   Last_Errno: 0
                   Last_Error:
                 Skip_Counter: 0
          Exec_Master_Log_Pos: 13453173
              Relay_Log_Space: 15626372
              Until_Condition: None
               Until_Log_File:
                Until_Log_Pos: 0
           Master_SSL_Allowed: No
           Master_SSL_CA_File:
           Master_SSL_CA_Path:
              Master_SSL_Cert:
            Master_SSL_Cipher:
               Master_SSL_Key:
        Seconds_Behind_Master: NULL
Master_SSL_Verify_Server_Cert: No
                Last_IO_Errno: 0
                Last_IO_Error:
               Last_SQL_Errno: 0
               Last_SQL_Error:
  Replicate_Ignore_Server_Ids:
             Master_Server_Id: 71
                  Master_UUID: 9b0dcf62-29f4-11e3-9471-677b33903869
             Master_Info_File: mysql.slave_master_info
                    SQL_Delay: 0
          SQL_Remaining_Delay: NULL
      Slave_SQL_Running_State:
           Master_Retry_Count: 86400
                  Master_Bind:
      Last_IO_Error_Timestamp:
     Last_SQL_Error_Timestamp:
               Master_SSL_Crl:
           Master_SSL_Crlpath:
           Retrieved_Gtid_Set:
            Executed_Gtid_Set:
                Auto_Position: 0
1 row in set (0.00 sec)

mysql>
之后启动slave,start slave;搞定。 11,网友 Aeolus@普 的提示DEADLOCK ON FLUSH TABLES WITH READ LOCK + SHOW SLAVE STATUS Problem: If a client thread on an slave does FLUSH TABLES WITH READ LOCK; then master does some updates, SHOW SLAVE STATUS in the same client will be blocked. Analysis: Execute FLUSH TABLES WITH READ LOCK on slave and at the same time execute a DML on the master. Then the DML should be made to stop at a state “Waiting for commit lock”. This state means that sql thread is holding rli->data_lock and waiting for MDL_COMMIT lock. Now in the same client session where FLUSH TABLES WITH READ LOCK was executed issue SHOW SLAVE STATUS command. This command will be blocked waiting for rli->data_lock causing a dead lock. Once this happens it will not be possible to release the global read lock as “UNLOCK TABLES” command has to be issued in the same client where global read lock was acquired. This causes the dead lock. Fix: Existing code holds the rli->data_lock for the whole duration of commit operation. Instead of holding the lock for entire commit duration the code has been restructured in such a way that the lock is held only during the period when rli object is being updated.然后去查了下我这台db从服务器,确实有每我这台从库是 有做mysqldump备份的,一个小时备份一次,然后cacti监控也会每分钟就来抽取一次数据,可能还真的是 mysqldump+cacti的show slave status一起执行导致的bug 出现。我先去将备份改成4个小时一次,继续观察后续情况。 (责任编辑:最模板) |
剖析MySQL5.6.12 Waiting for commit lock导致从卡死
时间:2016-01-06 23:07来源:未知 作者:最模板 点击:次
nagios报警,线上一台从库检测不到slave状态,于是远程上去查看问题: 1,show slave status\G卡住: Type help; or \h for help. Type \c to clear the current input statement.mysql show slave status\G show slave statu
顶一下
(0)
0%
踩一下
(0)
0%
------分隔线----------------------------
- 热点内容
-
- mysql中的case when 和ifnull判断
mysql 在查询和更新sql中都可以进行判断,下面根据我这两条sql看...
- MySql导出表结构为word文档
本文主要介绍下使用DBExportDoc V1.0 For MySQL配合mysql-connector-odbc-5...
- MySQL压力测试工具mysqlslap详解
mysqlslap是MySQL 自带的压力测试工具,可以模拟出大量客户端同时...
- mysql查询超时PHP执行效率分析比较
近来遇到一个问题,就是在高并发下,mysql功能呈现了瓶颈,由...
- 几个MySQL环境问题的对比
有时候出现了环境问题,对比是一种很好的方式,如果对比得当...
- mysql中的case when 和ifnull判断
- 随机模板
-
-
 shopex名仕模板
人气:362
shopex名仕模板
人气:362
-
 Magento高雅简洁化妆品Cos
人气:300
Magento高雅简洁化妆品Cos
人气:300
-
 ecshop仿妙乐乐母婴用品商
人气:665
ecshop仿妙乐乐母婴用品商
人气:665
-
 ecshop易趣英文外贸模板
人气:1288
ecshop易趣英文外贸模板
人气:1288
-
 ecshop仿唯伊网模板|化妆品
人气:1710
ecshop仿唯伊网模板|化妆品
人气:1710
-
 Prestashop英文医疗护理网站
人气:209
Prestashop英文医疗护理网站
人气:209
-